Economic and Policy Landscape
The macroeconomic backdrop for municipal markets remained constructive through Q2 2026, supported by resilient U.S. growth, a strong profit cycle, and historic AI-related spending. Global growth was uneven, with weak European GDP and structural headwinds in China, but recession concerns faded as inflation eased. The Fed is expected to remain on hold through 2026, and de-escalation in Iran relieved near-term pressure on rates and energy inflation. With valuations fuller across asset classes, the focus has shifted toward income carry, diversification, and selective risk rotation.
Municipal Credit Trends
Municipal credit fundamentals remained healthy, with state and local governments maintaining strong reserves, stable revenues, and disciplined fiscal management. Spreads tightened across most of the market, with BBB narrowing 6 basis points while AA widened slightly and A-rated held steady. As spreads compressed, investors increasingly rewarded issuers with resilient financials and stable revenue streams, while sectors facing policy or funding pressures saw greater differentiation.
Sector-Specific Developments
Sector performance was led by Hospitals (3.10%), Housing (2.72%), and Education (2.69%), while Resource Recovery, IDR/PCR, and State GOs lagged. Healthcare remained the most closely monitored sector amid Medicaid, ACA, and labor cost concerns, while higher education faced demographic and federal funding pressures. Transportation and essential-service utilities remained fundamentally sound, and prepaid gas continued to expand as a meaningful source of relative value. AI infrastructure and data-center development also drove financing needs across power, water, and transportation — particularly in Texas.
Market Performance
Q2 2026 performance was driven by falling yields and strong technical support, reversing much of the first-quarter weakness. The 10-year yield fell 19 basis points to 2.89% and the 30-year declined 37 basis points to 4.13%, with long-duration bonds leading the rally — the 20-year index returned 4.29% and the 30-year gained 4.20%. The Core Municipal Index led broad benchmarks at 2.50%, outperforming Intermediate (1.34%) and Short/Moderate (0.83%). BBB municipals led credit tiers at 3.47%, and 4%–5% coupon bonds delivered the strongest structure returns at 3.99%.
Municipal Outlook
The outlook for the remainder of 2026 remains constructive, supported by attractive tax-exempt income, healthy credit fundamentals, and strong seasonal reinvestment demand. Elevated issuance will remain a defining feature, and with valuations considerably richer, future returns will depend more on coupon income, curve positioning, and active management than on further spread compression. Sage will continue emphasizing security selection, with preferred exposure in select single-A credits, prepaid gas transactions, and healthcare and higher education issuers with strong fundamentals.
Municipal Fixed Income Allocations & Recent Change
| Sector | Positioning & Recent Changes |
|---|---|
| State General Obligation | State credits remained among the strongest segments of the municipal market in Q2. Most issuers maintained healthy reserve levels, manageable debt burdens, and stable revenue collections. Credit quality was broadly favorable, and rating activity generally continued to support the long-term strength of municipal fundamentals. Several states continued to benefit from strong population growth, healthy economic activity, and robust tax collections. While revenue growth moderated from the extraordinary levels observed following the pandemic, fiscal positions remained significantly stronger than historical averages. |
| Local General Obligation | Local general obligation credits delivered solid performance during the second quarter as strong technical conditions, declining municipal yields, and resilient credit fundamentals supported investor demand across the sector. Most local issuers entered the quarter with healthy reserve levels, manageable debt burdens, and stable property tax collections, allowing credit quality to remain broadly favorable despite moderating economic growth. While pockets of headline risk remain for large urban issuers facing budgetary and demographic pressures, spreads generally remained stable as investors focused on the sector’s durable tax-backed revenue streams and essential public-service role. |
| Healthcare, Utilities and Transportation | Healthcare remained one of the market's most actively analyzed sectors. While operating performance improved for many healthcare systems, investors grew increasingly focused on reimbursement risk, Medicaid exposure, and issuer-specific operating fundamentals. Strong systems with favorable demographics and sustainable margins continued to outperform weaker credits facing policy or utilization challenges. Transportation credits remained fundamentally sound throughout the quarter. Airports, toll roads, and other transportation issuers generally maintained healthy financial positions and strong operating trends. Essential-service utilities continued benefiting from stable demand and strong underlying credit characteristics. |
| Quasi-Corporate | The prepaid gas market also continued to expand rapidly. Several of the largest transactions completed during the quarter were prepaid energy financings, highlighting the growing importance of the sector within the municipal market. Increased issuance volume, a broader set of counterparties, and evolving transaction structures have created both opportunities and the need for greater credit differentiation. |
Don’t Be Fooled By Higher Gross Yields – After-Tax Yields Matter
On a gross basis, sectors like corporates (5.20%), securitized (4.96%), and government-related (4.72%) all screen higher than the Muni Broad Market at 3.58%. But once they are tax-adjusted at a 45% blended rate, the picture flips: the muni tax-equivalent yield jumps to 6.50%, well ahead of corporates at 2.86% and the US Agg at 2.60%. Stable muni yields plus tax-free income continue to deliver a real advantage — particularly for investors in federal brackets above 30%, where both Intermediate and Core strategies retain their edge.

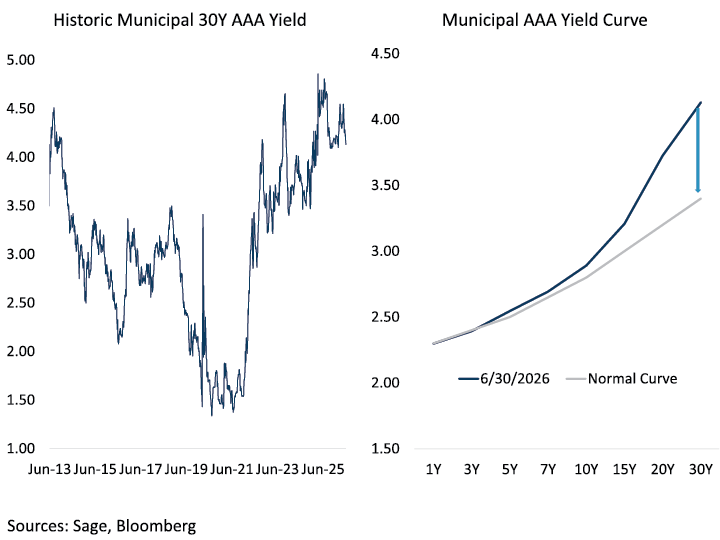
Municipal 30Y Yields Are Near Historic Highs Along With A Steep Curve
The long-term BVAL AAA history shows the 30Y yield sitting at 4.13% — near multi-decade highs following the recent sell-off — while the current curve overlay makes the steepness impossible to miss: 1Y at 2.30% rising to 4.13% at 30Y, versus a “normal” curve that would top out closer to 3.40%. Together, these two dynamics — elevated absolute yields and an abnormally steep curve — reinforce the idea that investors are being paid to extend, that fund flows are already tilting toward long-dated strategies, and that both income and price return potential are most favorable at the long end.