Consumer Strength Anchors Bank Earnings

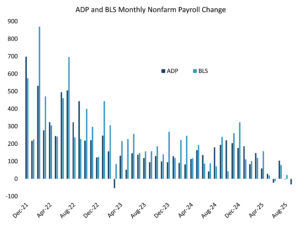
US banks delivered robust earnings this quarter, driven by continued expansion in net interest income and strong fee revenues. Although isolated events — such as fraud cases and the First Brands bankruptcy — introduced some market volatility, their impact was limited. Overall, consumer resilience and the soundness of the banking sector remained intact.

The largest banks — “the Big 6” — posted standout results in capital markets and investment banking, fueled by a surge in corporate activity. Credit trends remain broadly healthy, with net charge-offs, nonperforming assets, and reserves holding steady.

Many institutions, including Fifth Third, Truist, U.S. Bank, PNC, First Horizon, and Synchrony, noted lighter provisions for credit losses, reflecting stronger-than-expected credit performance. Ally Financial highlighted a significant year-over-year decline in auto net charge-offs and delinquencies and now expects results at or below prior guidance. Huntington and KeyCorp reported stable-to-improving asset quality, with modest increases in net charge-offs remaining within forecasted ranges. Wells Fargo, Morgan Stanley, and Goldman Sachs posted notably low or even zero provisions, underscoring confidence in their credit books. Concerns arose as Zions disclosed a $50 million write-off due to borrower irregularities, but our assessment is that this is an isolated event rather than a systemic concern. Despite outsized equity volatility in bank stocks, banking credits remained remarkably stable. Overall, the sector is benefiting from resilient consumer and commercial credit trends. Profitability is further supported by reserve releases and a decline in criticized loans.


Source: Sage, Bloomberg 

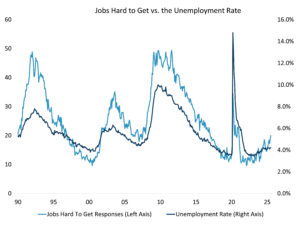
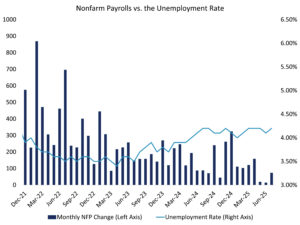
This quarter’s bank earnings provided a clear view into the resilience of the real economy. Household and private sector consumption remained strong, even amid ongoing policy and macroeconomic uncertainty. The data reinforced the strength of consumer credit, with most prime and near-prime borrowers maintaining financial stability — supported by low unemployment and the wealth effect from buoyant financial markets.

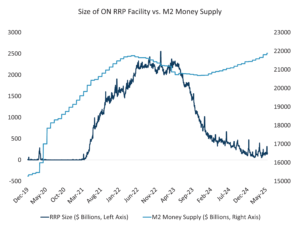
Looking at the broader picture, households have been in a long-term deleveraging trend since the Global Financial Crisis. According to the Federal Reserve’s flow of funds data, household liabilities relative to assets are now at their lowest level in over 50 years, making consumers less vulnerable to economic shocks.


Source: Federal Reserve, Sage 

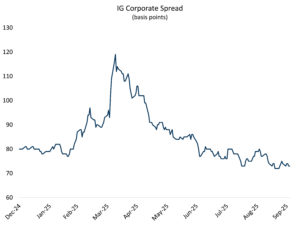
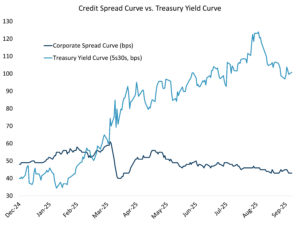
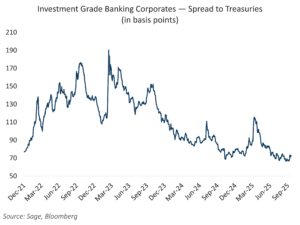
With another strong earnings season behind them, banks are in a much stronger position than they were entering the regional banking crisis of 2023. They have built excess loan loss reserves and capital, enhancing their ability to weather unexpected economic shifts. Corporate bond investors have expressed increased confidence in the health and transparency of bank loan portfolios, as reflected in the limited sell-off in bank bond spreads. Much of the risk associated with overleveraged borrowers has shifted to private markets, which should help mitigate potential damage in a future credit cycle. Banks are also benefiting from a more measured regulatory environment under the Trump presidency, which is expected to support sector growth and spur further bank M&A activity as the need for scale continues to rise.


Disclosures: This is for informational purposes only and is not intended as investment advice or an offer or solicitation with respect to the purchase or sale of any security, strategy, or investment product. Although the statements of fact, information, charts, analysis and data in this report have been obtained from, and are based upon, sources Sage believes to be reliable, we do not guarantee their accuracy, and the underlying information, data, figures and publicly available information has not been verified or audited for accuracy or completeness by Sage. Additionally, we do not represent that the information, data, analysis, and charts are accurate or complete, and as such should not be relied upon as such. All results included in this report constitute Sage’s opinions as of the date of this report and are subject to change without notice due to various factors, such as market conditions. Investors should make their own decisions on investment strategies based on their specific investment objectives and financial circumstances. All investments contain risk and may lose value. Past performance is not a guarantee of future results.

Sage Advisory Services Ltd. Co. is a registered investment adviser that provides investment management services for a variety of institutions and high net worth individuals. For additional information on Sage and its investment management services, please view our website at www.sageadvisory.com, or refer to our Form ADV, which is available upon request by calling 512.327.5530.

Hiring Hits a Wall: Private Labor Data Flags Economic Softness

In a world that clings to every labor data release for clues about potential shifts in monetary policy, the absence of official data adds a fresh layer of uncertainty for market participants. Since the government shutdown began on October 1st, only a handful of reports from private and non-governmental sources have offered glimpses into labor market conditions — and they continue to point toward a gradual deceleration.

The ADP National Employment Report is a monthly estimate of private-sector payroll employment, based on actual payroll data from millions of workers. Its measure of nonfarm employment change serves as a counterpart to the Bureau of Labor Statistics’ (BLS) nonfarm payroll figures. For September, ADP reported a decline of 32,000 jobs — one of the weakest readings since the pandemic — signaling a continued slowdown in hiring. The report was released on October 1st, just as the government shutdown began.


Source: Sage, ADP, BLS

In the absence of official data, private sources have become increasingly important for gauging labor market conditions. One such source is Revelio Labs’ Public Labor Statistics (RPLS), a monthly dataset that tracks employment, hiring rates, and job openings using over 100 million public professional profiles. Its September report, released on October 2nd, showed a modest gain of 60,000 nonfarm jobs. Similarly, Indeed’s US job postings, updated on October 8th, continue to show a sharp decline throughout the year. Together, these private indicators reinforce the narrative of a gradually cooling labor market over the past 12 months.


Source: Revelio, Indeed, Sage

Complementing these private employment indicators is the Challenger Job Cuts Report, which tracks layoffs across both corporate and private sectors using publicly available data, press releases, and company disclosures. The latest report, released on October 2nd, did little to shift the narrative of a stagnant labor market. So far this year, 948,000 job cuts have been announced — the highest year-to-date total since 2020 — with 299,000 of those coming from the government sector, largely driven by earlier Department of Governmental Efficiency (DOGE) reductions. Additionally, employers have announced plans to hire just 205,000 workers this year, marking the lowest year-to-date hiring figure since 2009.


Source: Challenger, Sage

Taken together, these non-governmental data sources continue to point to a weakening labor market, with hiring activity at some of the lowest levels seen since 2009. For an FOMC intent on staying “ahead of the curve” in supporting employment, these figures — viewed in isolation — provide continued justification for further rate cuts. However, that stance could shift if inflation unexpectedly accelerates in the near term.


Disclosures: This is for informational purposes only and is not intended as investment advice or an offer or solicitation with respect to the purchase or sale of any security, strategy, or investment product. Although the statements of fact, information, charts, analysis and data in this report have been obtained from, and are based upon, sources Sage believes to be reliable, we do not guarantee their accuracy, and the underlying information, data, figures and publicly available information has not been verified or audited for accuracy or completeness by Sage. Additionally, we do not represent that the information, data, analysis, and charts are accurate or complete, and as such should not be relied upon as such. All results included in this report constitute Sage’s opinions as of the date of this report and are subject to change without notice due to various factors, such as market conditions. Investors should make their own decisions on investment strategies based on their specific investment objectives and financial circumstances. All investments contain risk and may lose value. Past performance is not a guarantee of future results.

Sage Advisory Services Ltd. Co. is a registered investment adviser that provides investment management services for a variety of institutions and high net worth individuals. For additional information on Sage and its investment management services, please view our website at www.sageadvisory.com, or refer to our Form ADV, which is available upon request by calling 512.327.5530.

Corporate Bond Supply: A Non-Issue for Spreads?

Following the tariff disruptions in April, improving financial conditions have supported asset markets and spurred corporate interest in public debt financing. Investment grade corporate bond issuance reached $1.27 trillion through September — marking the highest volume since the post-pandemic surge in 2020.


Source: Citi, Sage 

An increase in bond supply would typically pressure corporate bond markets, as investors demand higher spreads and lower prices to absorb the new debt. Yet, since April, corporate spreads have tightened to levels not seen since the mid-1990s.


Source: Sage, Bloomberg 

There’s a key nuance to the rise in bond supply: corporations are favoring shorter-maturity debt to benefit from lower interest rates at the front end of the yield curve and preserve flexibility to refinance if long-term rates decline. As a result, most investment grade issuance has maturities of 10 years or less, leading to a scarcity of longer-dated bonds. This trend is reflected in the spread curve, which has flattened significantly — even as the yield curve has steepened — reaching its lowest point of the year outside of the Liberation Day shock.


Source: Sage, Bloomberg 

Although this year’s corporate bond issuance is the largest since 2020 in dollar terms, the overall spread duration is lower due to the shorter maturities of the new debt. This has created a mixed impact on the corporate bond market, with effects varying by maturity segment. As long as issuance remains concentrated in short and intermediate maturities, investors may continue to overlook elevated supply, focusing instead on supportive monetary policy and a resilient economy as the key drivers of spread performance.


Disclosures: This is for informational purposes only and is not intended as investment advice or an offer or solicitation with respect to the purchase or sale of any security, strategy, or investment product. Although the statements of fact, information, charts, analysis and data in this report have been obtained from, and are based upon, sources Sage believes to be reliable, we do not guarantee their accuracy, and the underlying information, data, figures and publicly available information has not been verified or audited for accuracy or completeness by Sage. Additionally, we do not represent that the information, data, analysis, and charts are accurate or complete, and as such should not be relied upon as such. All results included in this report constitute Sage’s opinions as of the date of this report and are subject to change without notice due to various factors, such as market conditions. Investors should make their own decisions on investment strategies based on their specific investment objectives and financial circumstances. All investments contain risk and may lose value. Past performance is not a guarantee of future results.

Sage Advisory Services Ltd. Co. is a registered investment adviser that provides investment management services for a variety of institutions and high net worth individuals. For additional information on Sage and its investment management services, please view our website at www.sageadvisory.com, or refer to our Form ADV, which is available upon request by calling 512.327.5530.

Stuck in the Middle

The August PCE inflation report confirmed that price pressures remain stuck in a holding pattern. Headline PCE rose 0.26% month-over-month and 2.74% year-over-year, while core PCE increased 0.23% MoM and held steady at 2.91% YoY. Inflation is not accelerating, but it is not falling quickly enough to reassure the Fed that the path back to 2% is secure.

The impact of tariffs on inflation remains modest. The current pace of price growth is similar to July, holding near the upper end of its historical range (excluding the COVID period). Within the PCE basket, goods excluding food and energy are rising at 1% year-over-year, which means that tariffs are having an effect, but firms seem to still be relying on inventories and absorbing cost pressures to maintain sales.


Source: Bureau of Economic Analysis, Sage

Meanwhile, housing and core services continue to be the largest contributors to prices, and both continue to show a clear downtrend, which should help keep overall inflation subdued. Consumer activity remains resilient, with spending up 0.6% in August, surpassing consensus expectations.


Source: Bureau of Economic Analysis, Sage

Last week Fed officials pushed back on the notion of imminent rate cuts in a barrage of speeches. Fed Chair Powell described policy as “modestly restrictive” and noted that tariffs have pushed some goods prices higher, but he also stressed that the pass-through remains small. He emphasized there is “no risk-free path” forward, a phrase that highlights the Fed’s balancing act. Cleveland Fed President Beth Hammack argued caution is still warranted given that inflation is above target, while Chicago’s Austan Goolsbee suggested there is room to cut if disinflation resumes, though not before the data confirm it. Richmond Fed President Tom Barkin emphasized the dilemma facing the FOMC, while Atlanta’s Raphael Bostic stated outright that he was hesitant to support a rate cut in October.


Source: Bloomberg, Sage

Real yields jumped 20 bps after the FOMC meeting, injecting some uncertainty into the Fed’s path. Still, the broader trend points to lower rates. The next key data arrives this week with the upcoming labor market reports. An upside surprise to employment and wages would reinforce the Fed’s two-sided mandate risk, while weaker data could boost confidence that inflation will continue to ease. Job openings are likely to show declines in both demand and supply – a historically unusual dynamic. Additionally, new downside risk has emerged: a potential government shutdown. While past shutdowns have been temporary, they still hurt the real economy and would delay the release of labor data, adding uncertainty to the outlook.


Disclosures: This is for informational purposes only and is not intended as investment advice or an offer or solicitation with respect to the purchase or sale of any security, strategy, or investment product. Although the statements of fact, information, charts, analysis and data in this report have been obtained from, and are based upon, sources Sage believes to be reliable, we do not guarantee their accuracy, and the underlying information, data, figures and publicly available information has not been verified or audited for accuracy or completeness by Sage. Additionally, we do not represent that the information, data, analysis, and charts are accurate or complete, and as such should not be relied upon as such. All results included in this report constitute Sage’s opinions as of the date of this report and are subject to change without notice due to various factors, such as market conditions. Investors should make their own decisions on investment strategies based on their specific investment objectives and financial circumstances. All investments contain risk and may lose value. Past performance is not a guarantee of future results.

Sage Advisory Services Ltd. Co. is a registered investment adviser that provides investment management services for a variety of institutions and high net worth individuals. For additional information on Sage and its investment management services, please view our website at www.sageadvisory.com, or refer to our Form ADV, which is available upon request by calling 512.327.5530.

Rate Relief and Mortgage Spread Compression

As expected, the Fed cut rates at its September FOMC meeting, lowering the funds target range by 25 basis points – at 4.00% to 4.25% – after holding steady since December. The decision reflected recent weakness in labor markets, sparking concern over a growth slowdown even as inflation remains above target. The Committee’s updated projections point to additional cuts through 2025 and a steady glide path lower through 2027. In his remarks, Fed Chair Powell framed the move as a step toward neutrality — acknowledging that the balance of risks has shifted from inflation toward employment. This shift makes the MBS market’s continued strength especially noteworthy, reinforcing themes we’ve been tracking and suggesting further room for relative outperformance.

Agency mortgage-backed securities (MBS) are bonds backed by the cash flows of residential mortgages, most often issued through government-sponsored entities such as Fannie Mae and Freddie Mac. These securities carry minimal credit risk due to implicit government backing, but they are subject to interest rate risk, which alters prepayment speeds and cash flow timing.

One of the key measures of MBS relative value is the “mortgage basis” — the spread between agency MBS and comparable Treasuries. This spread compensates investors for prepayment and sector risks, and it typically widens when volatility rises. After blowing out to multi-year highs in 2022, the basis has steadily retraced. Today it is approaching the narrow levels last seen in 2023, after labor market weakness emerged as a key concern for the economy, and it now sits on the cusp of breaking below levels observed post-Fed hike.


Source: Sage, Bloomberg 

At present, the current-coupon MBS basis is nearly 120 bps over Treasuries — a spread that still offers meaningful value. Investors can earn a greater yield pickup from owning AAA-rated MBS than from many lower-rated corporate bonds that carry credit risk. This dynamic underscores how much the sector continues to compensate investors for rate and prepayment uncertainty, even as spreads compress.

When interest rates fall, the duration of agency MBS shortens because borrowers are more likely to refinance early, which accelerates principal repayments and reduces a bond’s sensitivity to future rate changes. This creates a duration gap for benchmarked investors, prompting many to shift into longer-duration assets like Treasuries to stay aligned. At the same time, the need to hedge against convexity risk diminishes — shorter MBS duration means fewer Treasury sales for hedging purposes. These shifts in positioning and hedging can add momentum to the rate rally, supporting lower yields and reinforcing the relative strength of MBS.


Source: Sage, Bloomberg 

Looking ahead, the backdrop for MBS continues to improve. The Fed’s pivot toward easing should help lower rate volatility, removing one of the sector’s largest headwinds. Banks — historically, the largest buyers of mortgages — are on stronger footing and may step back in as demand returns. At the same time, the contraction in MBS duration and the resulting hedging dynamics are already reinforcing the rally in Treasuries, creating a virtuous cycle that supports valuations. Layered on top is the political wildcard: the administration’s focus on driving long-term yields and mortgage rates lower. With policymakers ultimately setting the rules of the game, that “unknown unknown” adds another tailwind, leaving agency MBS well-positioned for the next stage of the cycle.


Disclosures: This is for informational purposes only and is not intended as investment advice or an offer or solicitation with respect to the purchase or sale of any security, strategy, or investment product. Although the statements of fact, information, charts, analysis and data in this report have been obtained from, and are based upon, sources Sage believes to be reliable, we do not guarantee their accuracy, and the underlying information, data, figures and publicly available information has not been verified or audited for accuracy or completeness by Sage. Additionally, we do not represent that the information, data, analysis, and charts are accurate or complete, and as such should not be relied upon as such. All results included in this report constitute Sage’s opinions as of the date of this report and are subject to change without notice due to various factors, such as market conditions. Investors should make their own decisions on investment strategies based on their specific investment objectives and financial circumstances. All investments contain risk and may lose value. Past performance is not a guarantee of future results.

Sage Advisory Services Ltd. Co. is a registered investment adviser that provides investment management services for a variety of institutions and high net worth individuals. For additional information on Sage and its investment management services, please view our website at www.sageadvisory.com, or refer to our Form ADV, which is available upon request by calling 512.327.5530.

Rate Cut Marks Start of Fed’s Shift Toward Neutrality

The Federal Reserve cut its benchmark interest rate by a quarter percentage point at the September FOMC meeting, lowering the federal funds target range to 4.00%–4.25% in its first reduction since December. The move, widely expected by markets, reflects growing concern over a cooling labor market even as inflation remains above the Fed’s 2% goal. Officials also confirmed that balance sheet runoff will continue under existing caps, signaling that quantitative tightening remains in place despite the shift in rates.

Fresh projections from the Fed’s Summary of Economic Projections show policymakers expect the policy rate to fall to 3.6% by year-end, implying two more cuts in 2025, followed by a gradual decline to 3.4% in 2026 and 3.1% in 2027. Inflation is forecast to ease from current levels—headline PCE at 2.7% and core at 2.9%—toward 2.6% in 2026 and 2.1% by 2027. Growth estimates were revised slightly higher to 1.6% for this year, while unemployment is projected to rise to 4.5% at year-end before edging lower in the years ahead.

Fed Chair Jerome Powell repeatedly commented on the declining demand for labor. Powell characterized the policy change as a recognition of the shifting balance of risks between inflation and employment. While goods prices have firmed, partly due to tariffs, Powell noted that labor demand is weakening faster than supply, pushing unemployment higher and raising downside risks to jobs. He described the cut as a step toward a more neutral stance, emphasizing that the Fed remains committed to its dual mandate even as inflation risks persist.

Looking forward, Powell stressed that policy would remain data dependent. The updated dot plot reveals a divided committee, with some officials favoring no further cuts and others advocating a more aggressive path. Markets currently expect at least one additional quarter-point reduction this year, but Powell underscored that future moves would hinge on inflation trends, labor market data, and the evolving impact of tariffs. For now, the Fed is treading a narrow path—easing to support employment without reigniting price pressures.


Disclosures: This is for informational purposes only and is not intended as investment advice or an offer or solicitation with respect to the purchase or sale of any security, strategy, or investment product. Although the statements of fact, information, charts, analysis and data in this report have been obtained from, and are based upon, sources Sage believes to be reliable, we do not guarantee their accuracy, and the underlying information, data, figures and publicly available information has not been verified or audited for accuracy or completeness by Sage. Additionally, we do not represent that the information, data, analysis, and charts are accurate or complete, and as such should not be relied upon as such. All results included in this report constitute Sage’s opinions as of the date of this report and are subject to change without notice due to various factors, such as market conditions. Investors should make their own decisions on investment strategies based on their specific investment objectives and financial circumstances. All investments contain risk and may lose value. Past performance is not a guarantee of future results.

Sage Advisory Services Ltd. Co. is a registered investment adviser that provides investment management services for a variety of institutions and high net worth individuals. For additional information on Sage and its investment management services, please view our website at www.sageadvisory.com, or refer to our Form ADV, which is available upon request by calling 512.327.5530.

What the Decline in ON RRP Means for Markets

All eyes are on the FOMC this week, with markets broadly anticipating a rate cut. Market participants will be closely analyzing the dot plot, the Summary of Economic Projections, and Fed Chair Powell’s press conference for signals on the future policy trajectory. Meanwhile, a quieter but significant shift is unfolding beneath the surface. With the overnight reverse repo facility (RRP) nearly depleted, Treasury bill issuance now directly reduces bank reserve balances, draining liquidity from the financial system. This change elevates the importance of money market dynamics, as tightening liquidity conditions could amplify financial stress.

In the aftermath of the Global Financial Crisis, the Federal Reserve began paying interest on reserves as a tool to maintain control over short-term interest rates. However, this mechanism was limited to large depository institutions, leaving smaller entities — including government-sponsored enterprises (GSEs), regional banks, and money market funds (MMFs) — unable to earn interest directly from the Fed. These institutions sought alternative short-term investments, which became problematic when the Fed attempted to raise rates. Excess liquidity kept overnight rates low despite policy changes, prompting the Fed to introduce the ON RRP. This allowed smaller players to lend to the Fed overnight, effectively establishing a floor under short-term rates and improving the Fed’s ability to transmit monetary policy.

In the wake of Covid, the Fed injected trillions of dollars into the economy through asset purchases, much of which flowed into MMFs. With Treasury bill yields suppressed due to limited issuance and regulatory constraints, MMFs parked their cash at the ON RRP facility, which ballooned to $2.5 trillion as interest rates rose in 2022. Since that time, increased Treasury bill issuance pushed yields above the ON RRP rate, prompting MMFs to shift funds from the Fed to T-bills.


Source: Sage, Bloomberg

This reallocation offset the liquidity drain from bond issuance, keeping the overall money supply stable. As T-bills have taken up a growing share of total Treasury issuance to fund the sizeable fiscal deficit, the ON RRP facility has been largely depleted. Going forward, each new round of T-bill issuance will require fresh capital from the market; otherwise, it will begin to pull liquidity directly from the broader financial system.


Source: Sage, Federal Reserve 

As the ON RRP facility nears depletion, money markets are likely to become more sensitive to shifts in Treasury issuance and fluctuations in the Treasury’s cash balance. For the Fed, continued balance sheet runoff will intensify pressure on market liquidity, potentially complicating the effective transmission of monetary policy.


Disclosures: This is for informational purposes only and is not intended as investment advice or an offer or solicitation with respect to the purchase or sale of any security, strategy, or investment product. Although the statements of fact, information, charts, analysis and data in this report have been obtained from, and are based upon, sources Sage believes to be reliable, we do not guarantee their accuracy, and the underlying information, data, figures and publicly available information has not been verified or audited for accuracy or completeness by Sage. Additionally, we do not represent that the information, data, analysis, and charts are accurate or complete, and as such should not be relied upon as such. All results included in this report constitute Sage’s opinions as of the date of this report and are subject to change without notice due to various factors, such as market conditions. Investors should make their own decisions on investment strategies based on their specific investment objectives and financial circumstances. All investments contain risk and may lose value. Past performance is not a guarantee of future results.

Sage Advisory Services Ltd. Co. is a registered investment adviser that provides investment management services for a variety of institutions and high net worth individuals. For additional information on Sage and its investment management services, please view our website at www.sageadvisory.com, or refer to our Form ADV, which is available upon request by calling 512.327.5530.

Rates on the Precipice

Last week, the highly anticipated nonfarm payrolls report for August came in softer than expectations, printing just 22k jobs versus the consensus of 75k. Coupled with the downward revisions of -21k to prior months, the three-month average payroll is just under 30k, well below the pace needed to put downward pressure on the unemployment rate. This marks a sharp reversal from the robust labor market seen earlier in the year, which had been buoyed by a string of upside surprises in employment data through late 2024.

The shift in the health of the labor market is notable, especially as it coincides with other signs of labor market cooling. Job openings continue to decline, with the latest JOLTS data showing 7.2 million openings compared to 7.4 million unemployed — a ratio that has now turned negative after peaking at above 10 million in the post-pandemic recovery.


Source: Sage, BLS

The softening in employment data reinforces a dovish outlook for the FOMC. Interest rate markets are now pricing in a total of six rate cuts through early 2027, a notable shift in expectations compared to just a few weeks ago. Treasury Secretary Scott Bessent’s assertion from less than a month ago that “we should probably be 150 basis points lower” has quickly moved from contrarian to consensus. The market’s embrace of a lower rate trajectory reflects not only the labor data but also broader signs of economic deceleration, and it suggests that the Fed may have more room to ease than previously thought.

Meanwhile, longer-maturity yields have remained remarkably stable. Since the Fed officially ended its hiking cycle in July 2023, the 10-year Treasury yield has hovered around 4.3%. This range-bound behavior has been more pronounced this year as interest rates have been stuck between two dynamics — on one side, the drag from slowing growth, and on the other, the inflationary risks posed by tariffs. Recent labor market developments have shifted the balance, with the distribution of rate outcomes for the remainder of the year now tilted toward the downside.


Source: Sage, Bloomberg

One area that may offer clues about whether we are truly in a regime change is the mortgage-backed securities (MBS) market. MBS spreads have recently tightened, approaching their narrowest levels since 2023. A decisive move lower could signal the onset of a new phase of Fed easing — one that not only supports rates and MBS valuations, but also drives broad-based strength across the entire spectrum of spread sectors.


Source: Sage, Bloomberg


Disclosures: This is for informational purposes only and is not intended as investment advice or an offer or solicitation with respect to the purchase or sale of any security, strategy, or investment product. Although the statements of fact, information, charts, analysis and data in this report have been obtained from, and are based upon, sources Sage believes to be reliable, we do not guarantee their accuracy, and the underlying information, data, figures and publicly available information has not been verified or audited for accuracy or completeness by Sage. Additionally, we do not represent that the information, data, analysis, and charts are accurate or complete, and as such should not be relied upon as such. All results included in this report constitute Sage’s opinions as of the date of this report and are subject to change without notice due to various factors, such as market conditions. Investors should make their own decisions on investment strategies based on their specific investment objectives and financial circumstances. All investments contain risk and may lose value. Past performance is not a guarantee of future results.

Sage Advisory Services Ltd. Co. is a registered investment adviser that provides investment management services for a variety of institutions and high net worth individuals. For additional information on Sage and its investment management services, please view our website at www.sageadvisory.com, or refer to our Form ADV, which is available upon request by calling 512.327.5530.

The Labor Market’s Tell

Over the past month, the labor market has taken center stage in the debate over the near-term trajectory of Fed policy. With inflation not showing a meaningful pickup in aggregate, jobs data may be the lynchpin for near-term rate cuts. If employment weakens meaningfully, the Fed gains cover to ease; if not, they risk waiting too long.

One under-the-radar but powerful signal is the Conference Board’s “Jobs Hard to Find” measure. It comes from the monthly Consumer Confidence Survey, where respondents are asked whether jobs are plentiful or hard to get. The index is constructed as the share of people who say jobs are difficult to find. While it’s a sentiment-based indicator, it has a strong historical correlation with the unemployment rate, jobless claims, and payroll growth. In fact, it often leads official labor data, since consumers are reporting what they experience in real time rather than waiting for lagging statistics to catch up.


Source: Sage, BLS, Conference Board 

Lately, this signal has turned meaningfully higher. The “Jobs Hard to Find” share has been grinding upward and now sits at its most elevated level since the early post-pandemic recovery. In past cycles, similar moves foreshadowed tougher labor prints ahead. Households may already be picking up on a slowdown that the official data will confirm later.

If the survey is picking up on true labor weakness, this strengthens the Fed’s case for a series of rate cuts starting this month. At the September FOMC meeting, Powell and his colleagues will have to balance the threat of tariffs on inflation against a labor market that looks increasingly vulnerable. The “Jobs Hard to Find” measure may prove to be one of the early warnings that the cycle has shifted.


Disclosures: This is for informational purposes only and is not intended as investment advice or an offer or solicitation with respect to the purchase or sale of any security, strategy, or investment product. Although the statements of fact, information, charts, analysis and data in this report have been obtained from, and are based upon, sources Sage believes to be reliable, we do not guarantee their accuracy, and the underlying information, data, figures and publicly available information has not been verified or audited for accuracy or completeness by Sage. Additionally, we do not represent that the information, data, analysis, and charts are accurate or complete, and as such should not be relied upon as such. All results included in this report constitute Sage’s opinions as of the date of this report and are subject to change without notice due to various factors, such as market conditions. Investors should make their own decisions on investment strategies based on their specific investment objectives and financial circumstances. All investments contain risk and may lose value. Past performance is not a guarantee of future results.

Sage Advisory Services Ltd. Co. is a registered investment adviser that provides investment management services for a variety of institutions and high net worth individuals. For additional information on Sage and its investment management services, please view our website at www.sageadvisory.com, or refer to our Form ADV, which is available upon request by calling 512.327.5530.

Jackson Hole Marks Powell’s Readiness to Ease

Fed Chair Jerome Powell’s speech at Jackson Hole last week marked a clear pivot from prior Fed communications, striking a more dovish tone than markets had expected. For much of this year, Powell emphasized patience and a cautious approach to easing. At Jackson Hole, he pivoted, acknowledging that the balance of risks has changed and that with inflation closer to target and policy already restrictive, “adjustments may soon be warranted.”

This shift did not come in a vacuum. Labor market data in recent months have been weaker than previously thought. Headline payroll gains have slowed sharply — from an average of over 200,000 per month in 2023 to just 35,000 in the most recent release — and downward revisions have erased much of the strength reported earlier in the year. The unemployment rate has edged up to 4.2%, and Powell described the current state as a “curious kind of balance,” one that results not from robust momentum but from a simultaneous slowing of both labor supply and labor demand. Such conditions, he warned, can tip quickly, raising the risk of a sharper deterioration.


Source: Sage, BLS 

Overlaying these cyclical concerns was a structural change in the Fed’s policy framework that was scheduled for this year. Powell confirmed the Fed is abandoning the “average inflation targeting” approach it adopted in 2020. That framework — designed for a world of weak demand, low interest rates, and chronic undershooting of inflation — allowed inflation to run above 2% for a time to make up for earlier shortfalls. The aim was to lift long-term inflation expectations and prevent premature tightening. But the post-pandemic economy is different. Tariffs have reshaped global trade, immigration has slowed, and repeated supply shocks have altered the complexion of inflation. In this environment, tolerating overshoots risks embedding inflation rather than raising expectations. Powell announced a return to a more traditional 2% target — flexible enough to acknowledge real-world frictions, but without the asymmetric bias that tolerated prolonged overshooting.

The combination of a stricter-sounding framework and a dovish policy stance may seem contradictory, but it reflects the Fed’s evolving calculus. Inflation is moving toward the target faster than expected, while the costs of holding policy at restrictive levels are rising. The new framework restores credibility to the Fed’s inflation objective, even as Powell’s tone makes clear that the near-term priority is guarding against unnecessary damage to employment. The timing of the shift is telling. It signals that the Fed is ready to exit the “higher for longer” phase and transition toward gradual easing, with September now squarely in play.

Political pressure provides another important backdrop. The White House has been calling for rate cuts to support growth and jobs, placing the Fed in a delicate position. Powell avoided any explicit reference, but by emphasizing labor-market risks and pointing to the downside of waiting too long, he effectively acknowledged the broader context. Maintaining independence while responding to real economic weakness is a fine balance, and Jackson Hole was Powell’s attempt to walk that line.

Markets took him at his word. Treasury yields fell across the curve, led by the front end, as traders quickly priced in a near-certain September cut. The yield curve began to steepen, reflecting expectations of a lower policy path and a Fed that is more responsive to growth risks than previously assumed. Real yields rolled over, and credit markets tightened in anticipation of an easier stance.

For fixed income investors, the debate is no longer about how long the restrictive policy will remain, but how fast the easing cycle will unfold and how far the Fed will ultimately go. The chart below shows the market implied probability of a Fed cut at the September meeting, which has hovered in a range since February. Following a steady decline after the latest weak labor data revisions, the market is now pricing in an 86% probability of a rate cut at the September FOMC meeting.


Source: Sage, Bloomberg

The message from Jackson Hole is clear: the Fed is pivoting from restraint to readiness. Inflation progress has given Powell room to maneuver, while weakening labor data and revisions have made the costs of inaction harder to ignore. September may well mark the start of a new phase in monetary policy — one where the focus shifts from fighting inflation at all costs to managing the risks of an economy that is already slowing.


Disclosures: This is for informational purposes only and is not intended as investment advice or an offer or solicitation with respect to the purchase or sale of any security, strategy, or investment product. Although the statements of fact, information, charts, analysis and data in this report have been obtained from, and are based upon, sources Sage believes to be reliable, we do not guarantee their accuracy, and the underlying information, data, figures and publicly available information has not been verified or audited for accuracy or completeness by Sage. Additionally, we do not represent that the information, data, analysis, and charts are accurate or complete, and as such should not be relied upon as such. All results included in this report constitute Sage’s opinions as of the date of this report and are subject to change without notice due to various factors, such as market conditions. Investors should make their own decisions on investment strategies based on their specific investment objectives and financial circumstances. All investments contain risk and may lose value. Past performance is not a guarantee of future results.

Sage Advisory Services Ltd. Co. is a registered investment adviser that provides investment management services for a variety of institutions and high net worth individuals. For additional information on Sage and its investment management services, please view our website at www.sageadvisory.com, or refer to our Form ADV, which is available upon request by calling 512.327.5530.