Resilient Labor, Resilient Valuations
July 15, 2025 By Sage Advisory
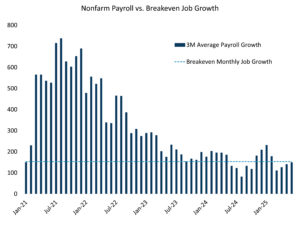
The US Labor market has remained remarkably resilient despite concerns about job cuts in the government sector and broader economic headwinds. Nonfarm payroll (NFP) growth has averaged around 150,000 per month over the past 3 months — closely aligning with the breakeven pace needed to maintain the unemployment rate near its historically low level of 4.1%. This steady job creation underscores the underlying strength of the economy, even as headline risks continue to dominate the narrative.

Source: Sage, BLS, St. Louis Fed
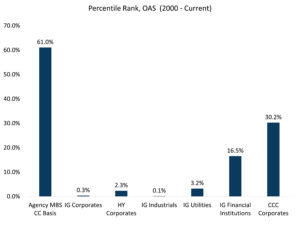
While geopolitical tensions, tariff uncertainties, and other macro risks persist, hard economic data continues to point toward ongoing expansion. Financial markets are echoing this optimism: equities are hovering near all-time highs, and corporate credit spreads are pricing in minimal risk. As shown in the chart below, corporate bond spreads are near the lowest percentile relative to the past 25 years — indicating no pricing of a near-term default cycle. In contrast, Agency MBS spreads remain relatively attractive, sitting at the 61st percentile, suggesting potential value in that segment.

Source: Sage, Bloomberg
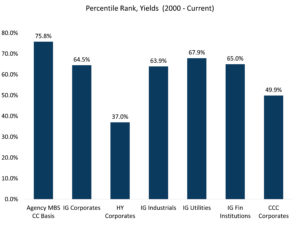
Ultimately, yield levels remain the dominant force behind investor flows. The chart below highlights the current percentile ranks of yields across various fixed income sectors. Investment grade (IG) corporates, for example, are yielding in the 64.5th percentile relative to the past 25 years — well above average. This elevated yield environment continues to attract inflows, particularly from investors seeking high-quality income opportunities in a low-volatility backdrop.

Source: Sage, Bloomberg
Disclosures: This is for informational purposes only and is not intended as investment advice or an offer or solicitation with respect to the purchase or sale of any security, strategy or investment product. Although the statements of fact, information, charts, analysis and data in this report have been obtained from, and are based upon, sources Sage believes to be reliable, we do not guarantee their accuracy, and the underlying information, data, figures and publicly available information has not been verified or audited for accuracy or completeness by Sage. Additionally, we do not represent that the information, data, analysis and charts are accurate or complete, and as such should not be relied upon as such. All results included in this report constitute Sage’s opinions as of the date of this report and are subject to change without notice due to various factors, such as market conditions. Investors should make their own decisions on investment strategies based on their specific investment objectives and financial circumstances. All investments contain risk and may lose value. Past performance is not a guarantee of future results.
Sage Advisory Services, Ltd. Co. is a registered investment adviser that provides investment management services for a variety of institutions and high net worth individuals. For additional information on Sage and its investment management services, please view our web site at sageadvisory.com, or refer to our Form ADV, which is available upon request by calling 512.327.5530.

